Troubleshoot Xdebug configuration on Valet+
• • ☕️ 2 min readValet+ is by far the best PHP development environment I’ve had. It comes bundled with awesome helper scripts and pre-installed tools like Xdebug.
For various reasons Xdebug might sometimes stop working and your favorite IDE won’t stop at breakpoints. The most frustrating thing.
Enable logging by adding xdebug.remote_log=/log_path/xdebug.log to the configuration. In Valet+ the responsible file for Xdebug
configuration is /usr/local/etc/valet-php/7.1/conf.d/z-performance.ini
I inspected the logs and saw the following:
[64274] I: Connecting to configured address/port: localhost:9000.
[64274] W: Creating socket for 'localhost:9000', poll success, but error: Operation now in progress (19).
[64274] I: Connected to client. :-)
[64274] -> <init xmlns="urn:debugger_protocol_v1" xmlns:xdebug="https://xdebug.org/dbgp/xdebug" fileuri="dbgp://stdin" language="PHP" xdebug:language_version="7.1.26" protocol_version="1.0" appid="64274" idekey="PHPSTORM"><engine version="2.7.2"><![CDATA[Xdebug]]></engine><author><![CDATA[Derick Rethans]]></author><url><![CDATA[https://xdebug.org]]></url><copyright><![CDATA[Copyright (c) 2002-2019 by Derick Rethans]]></copyright></init>
[64274]
[64274] -> <response xmlns="urn:debugger_protocol_v1" xmlns:xdebug="https://xdebug.org/dbgp/xdebug" status="stopping" reason="ok"></response>
So Xdebug is connected but there is error: Operation now in progress (19).
To be honest I’m not exactly sure what the error refers to since the behavior is rather incoherent. Sometimes the log won’t contain any errors but Xdebug is still not stopping at breakpoints.
[6146] I: Connecting to configured address/port: localhost:9000.
[6146] I: Connected to client. :-)
[6146] -> <init xmlns="urn:debugger_protocol_v1" xmlns:xdebug="https://xdebug.org/dbgp/xdebug" fileuri="file:///Users/tuomas.anakkala/.composer/vendor/weprovide/valet-plus/server.php" language="PHP" xdebug:language_version="7.1.26" protocol_version="1.0" appid="6146" idekey="PHPSTORM"><engine version="2.7.2"><![CDATA[Xdebug]]></engine><author><![CDATA[Derick Rethans]]></author><url><![CDATA[https://xdebug.org]]></url><copyright><![CDATA[Copyright (c) 2002-2019 by Derick Rethans]]></copyright></init>
[6146]
[6546] -> <response xmlns="urn:debugger_protocol_v1" xmlns:xdebug="https://xdebug.org/dbgp/xdebug" status="stopping" reason="ok"></response>
[6546]
[6146] -> <response xmlns="urn:debugger_protocol_v1" xmlns:xdebug="https://xdebug.org/dbgp/xdebug" status="stopping" reason="ok"></response>
[6146]
[6546] Log closed at 2019-06-15 11:55:56
I checked what is listening on the port 9000, on macOS Mojave you can see this by running:
lsof -nP -i4TCP:9000 | grep LISTEN
The output revealed that both php-fpm and phpstrom should listen this port.
php-fpm  1408 tuomas.anakkala    8u  IPv4 0xcc1f9ef7483025d5      0t0  TCP 127.0.0.1:9000 (LISTEN)
php-fpm  1642 tuomas.anakkala    9u  IPv4 0xcc1f9ef7483025d5      0t0  TCP 127.0.0.1:9000 (LISTEN)
php-fpm  1644 tuomas.anakkala    9u  IPv4 0xcc1f9ef7483025d5      0t0  TCP 127.0.0.1:9000 (LISTEN)
phpstorm 6580 tuomas.anakkala  387u  IPv4 0xcc1f9ef75c7aff55      0t0  TCP *:9000 (LISTEN)
For more reliable debugging you should change the port to some free which only PHPStorm is listening. The whole Xdebug configuration should look like this:
[xdebug]
xdebug.remote_enable=1
xdebug.remote_host=localhost
xdebug.remote_port=9001
xdebug.remote_autostart=1
xdebug.idekey=PHPSTORM
From PhpStorm remember to change the port from Preferences -> Languages & Frameworks -> PHP -> Xdebug.
Also delete all servers from Preferences -> Languages & Frameworks -> PHP -> Servers. PhpStorm will add these automatically after the incoming connection.
Configuration should look like this:
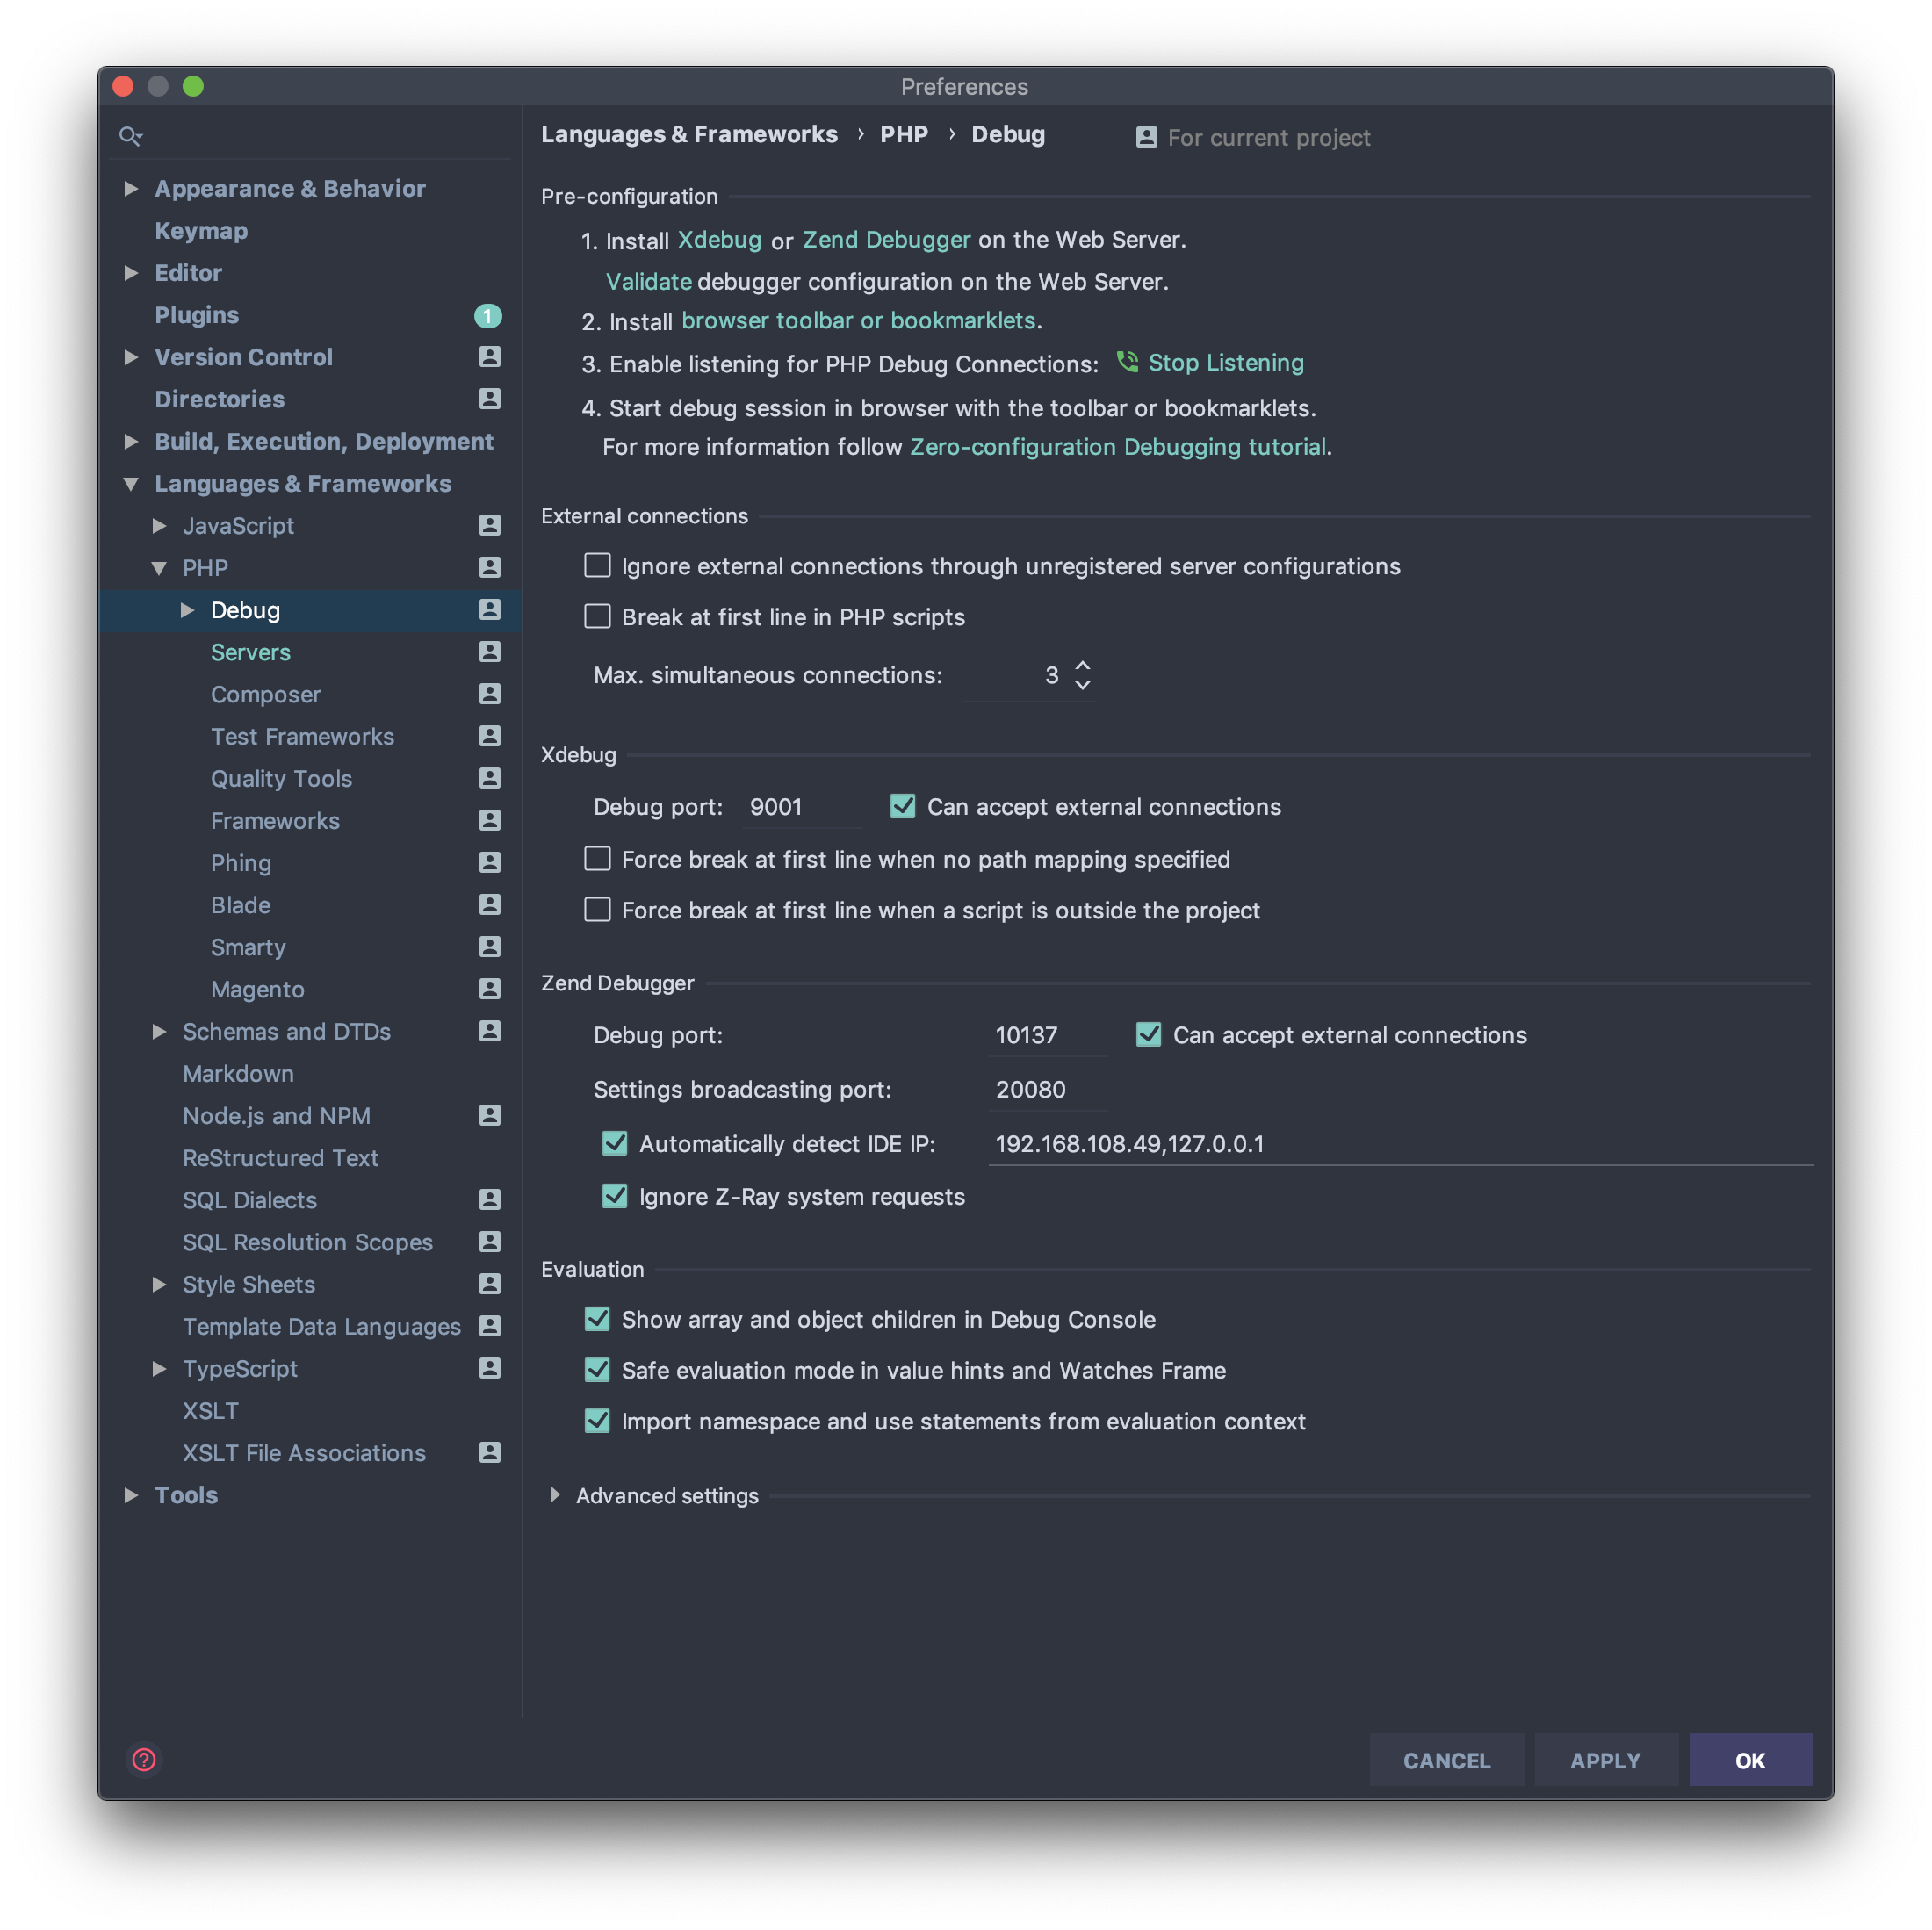
Run valet restart php to activate the new configuration and restart PhpStorm to apply the changes.
Add a breakpoint, hit refresh and you are ready to go.